Minneapolis Safety Data /menu
-----------------------------------
Minneapolis Police Dept
-----------------------------------
Officers ............................ 725
Vehicle Stops ....... 54% Black/E African
Vehicle Searches .... 78% Black/E African
Police Shooting Victims ....... 60% Black
Marijuana Sting Targets ....... 98% Black
Murders Solved ...................... 54%
Violent Crimes Solved ............... 36%
Total: $179 million
------------------------
Thank you for taxpaying!
------------------------

What does $179* million buy us?
Minneapolis has officially entered into a process of public safety transformation. A pledge to dismantle or defund the police. Does the Police Department produce safety? Does the economy? Does culture? Safety for who? What are the outcomes we're really talking about when we say safety?
How can we answer these questions without some data about what's really happening (and not happening)?
My goal with this project is to collect data that might help people in Minneapolis (like me) navigate this process effectively. At the center of this conversation must be the lived experiences of people who experience harms in this community: be they harms perpetrated by police, by strangers, by family, by corporations, or by bad luck. George Floyd matters. Data should not push those stories out of the center.
But others tell that story better than I can. And if we're going to move money, we better know where it is. We better be able to make our own arguments about how it can be used, in combination with what policies, to produce better outcomes. To produce safety that we can see and measure, for everyone.
* single numbers hide complication.
$179 represents the Mayor's proposed 2021 budget for Minneapolis Police Department. But it excludes the department that provides 911 service, which you may consider part of "Police." And that number is pending the outcome of a policy battle right now. Jump into Budget data.
Updates
My progress getting to the bottom of how we attempt to produce "safety"
12/2/20
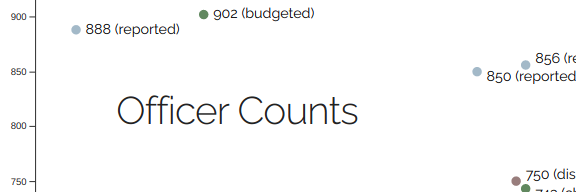
Updated the Officer Counts page with 2021 projections from Rondo's budget presentation.11/29/20
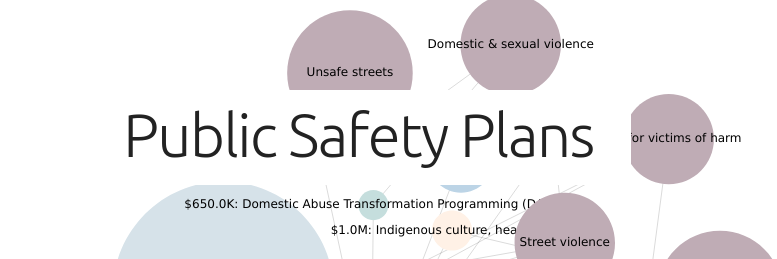
Created the Public Safety Plans tool which allows for visual exploration of two safety-related Minneapolis budget proposals: the People's Budget and Safety for All.11/14/20
Added a page summarizing research on New Safety Services emerging around the country that provide emergency/safety response outside of police departments. There is still more data to gather regarding Denver, Oakland, LA and NYC programs! But learned a lot about Eugene, Portland and San Francisco programs.10/11/20
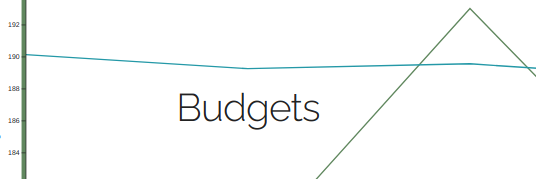
Added a change-over-time graph to the Budget page, and updated with data from the 2021 proposed budget. Next up: data on funding for "police alternatives" within Minneapolis as well as other cities.
10/1/20
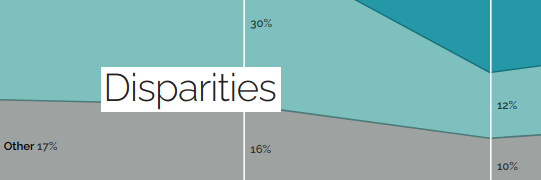
Added Disparities page.
8/28/20
Adding navigation and an explanation of the project purpose.
8/27/20
Added chart page: Budgets. Between collecting the data for this chart and adding it, the Police Department budget has already been revised (July)! Hopefully I can get around to adding that data soon to visualize the changes.
One thing that seems clear looking at the budget data: at the aggregate level, it doesn't tell much of a story. The city spends money on labor. I think this data will get a lot more interesting if I can cut it up further. Some ideas:
- Distribution of role + salary
- Rough estimates of cost per patrol, or cost per call/response
- Comparison to labor costs in other divisions (eg does public health hire people who are more or less expensive?)
8/23/20
First protoype chart page: Officer Counts.
8/20/20
First prototype of this site.